Skip to content

Margin of Error

Working notes on data, models and measurement

  • Essays
  • Notebooks
  • Methods
  • Series
    • Measuring what matters
    • Causal inference notes
  • About
    • Contact

Index

Latest posts

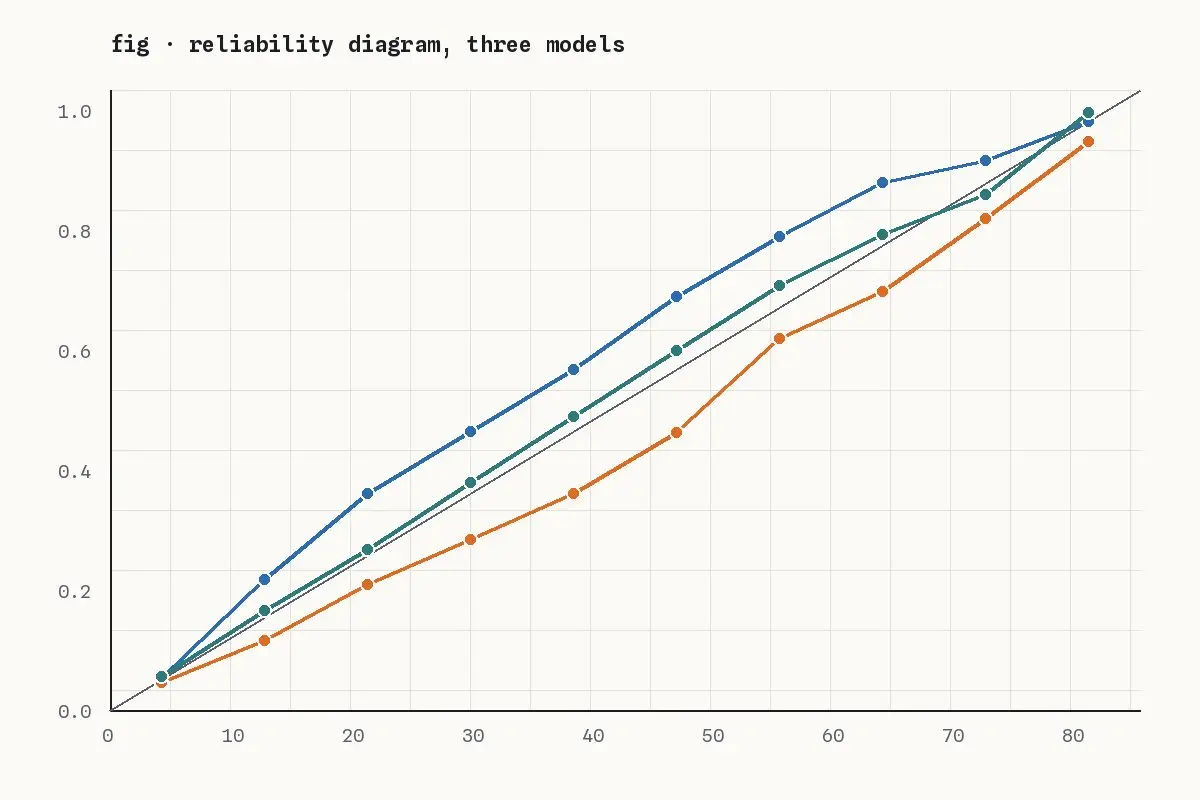
A reliability diagram: three model curves around the diagonal

FeaturedEssays

Calibration is the forecast quality nobody checks

Accuracy tells you how often a model is right. Calibration tells you whether its confidence means anything, and most dashboards never look.

October 22, 2026Demo AuthorRead “Calibration is the forecast quality nobody checks” →
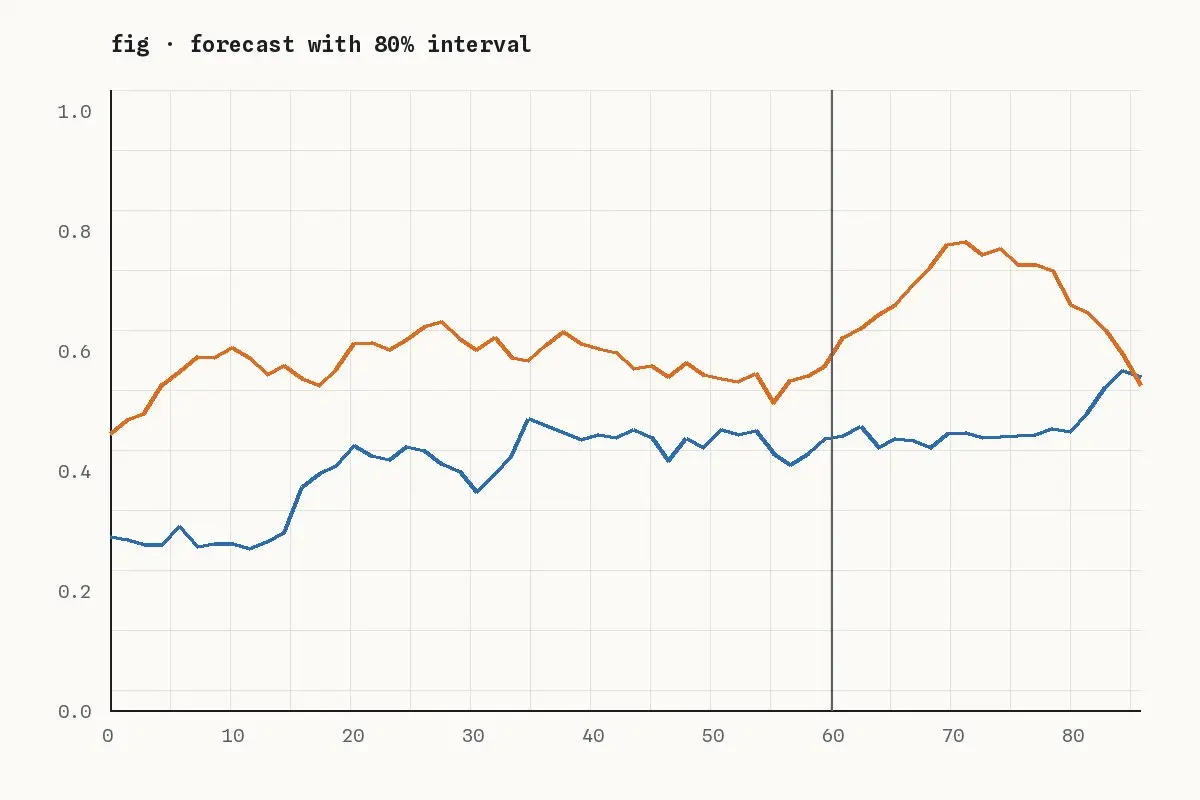
Two time series drifting apart after a vertical marker

Notebooks

Notebook: a drift monitor in forty lines of pandas

Population stability index, a rolling window and one chart: a feature drift monitor you can run before buying a platform.

October 8, 2026Demo AuthorRead “Notebook: a drift monitor in forty lines of pandas” →
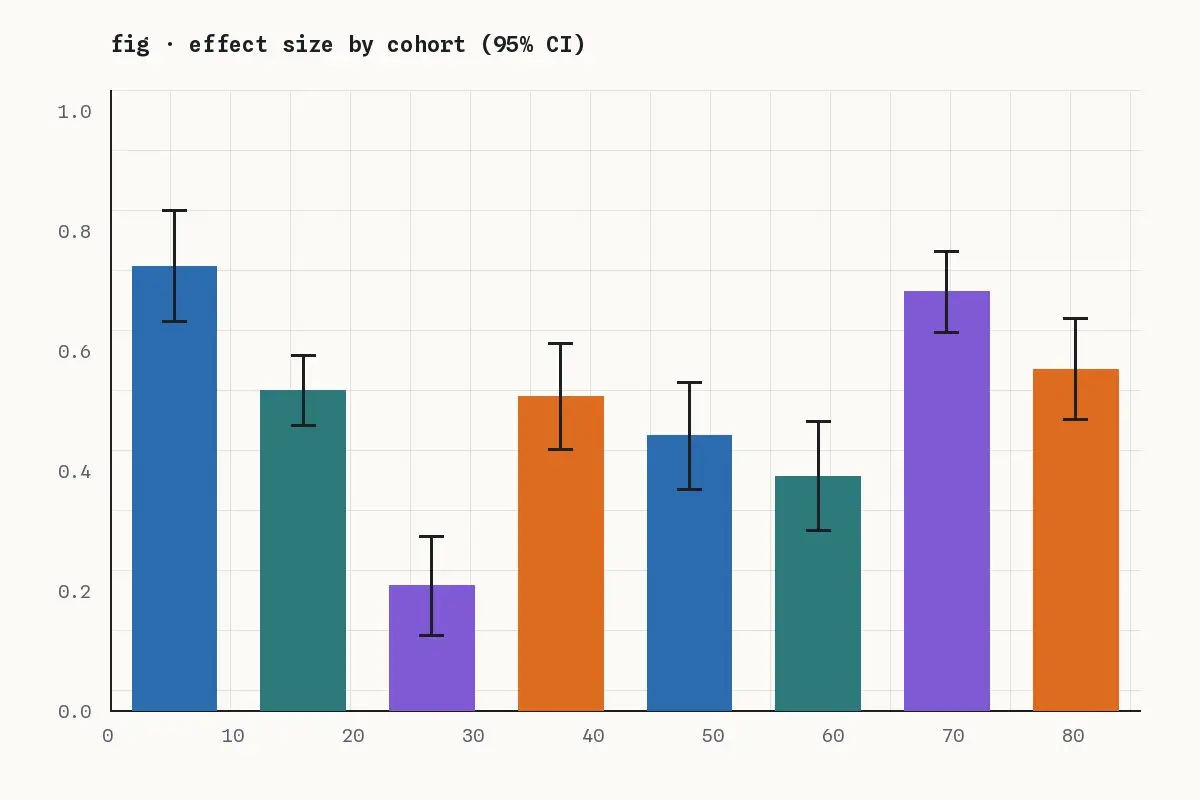
Bar chart of effect sizes by cohort with error bars

Measuring what matters

Measuring what matters, part 1: proxies and their failure modes

Every metric is a proxy for something you care about. The first part of this series catalogues the ways proxies break.

September 25, 2026Demo AuthorRead “Measuring what matters, part 1: proxies and their failure modes” →
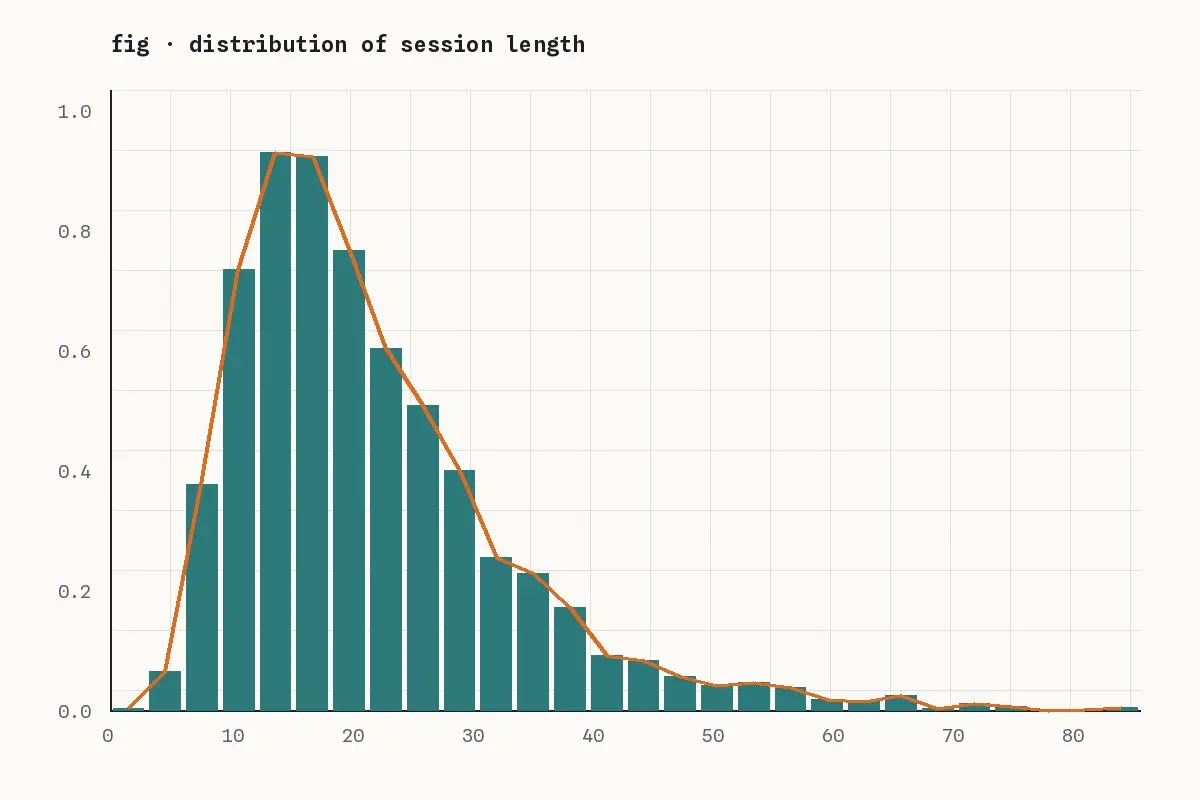
A right-skewed histogram of session lengths with a density curve

Measuring what matters

Measuring what matters, part 2: session length is a trap

Longer sessions look like engagement. Often they are confusion. A closer look at a heavily skewed distribution.

October 1, 2026Demo AuthorRead “Measuring what matters, part 2: session length is a trap” →
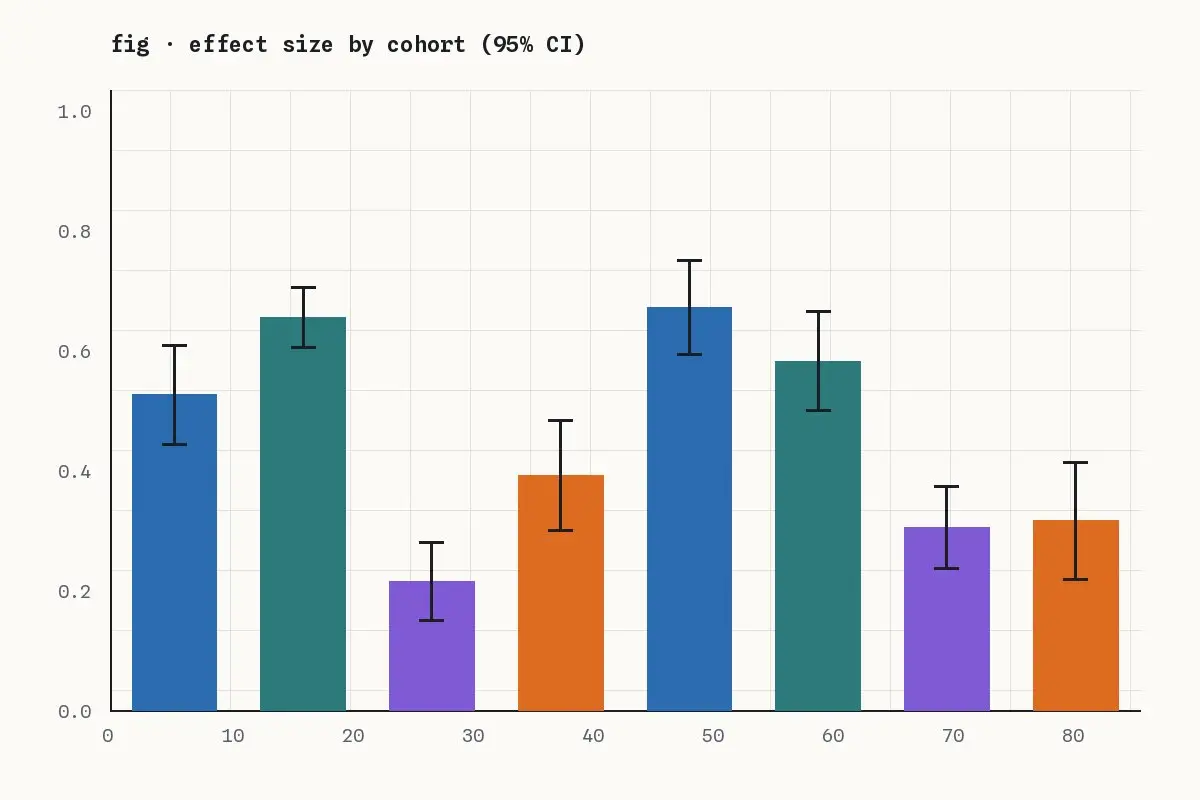
Bar chart comparing eight test variants with confidence intervals

Causal inference notes

Causal inference notes, part 1: pre-register your primary metric

With twenty metrics on the dashboard, one will move by chance in almost every test. Writing down the primary metric first is the cheapest fix.

September 11, 2026Demo AuthorRead “Causal inference notes, part 1: pre-register your primary metric” →
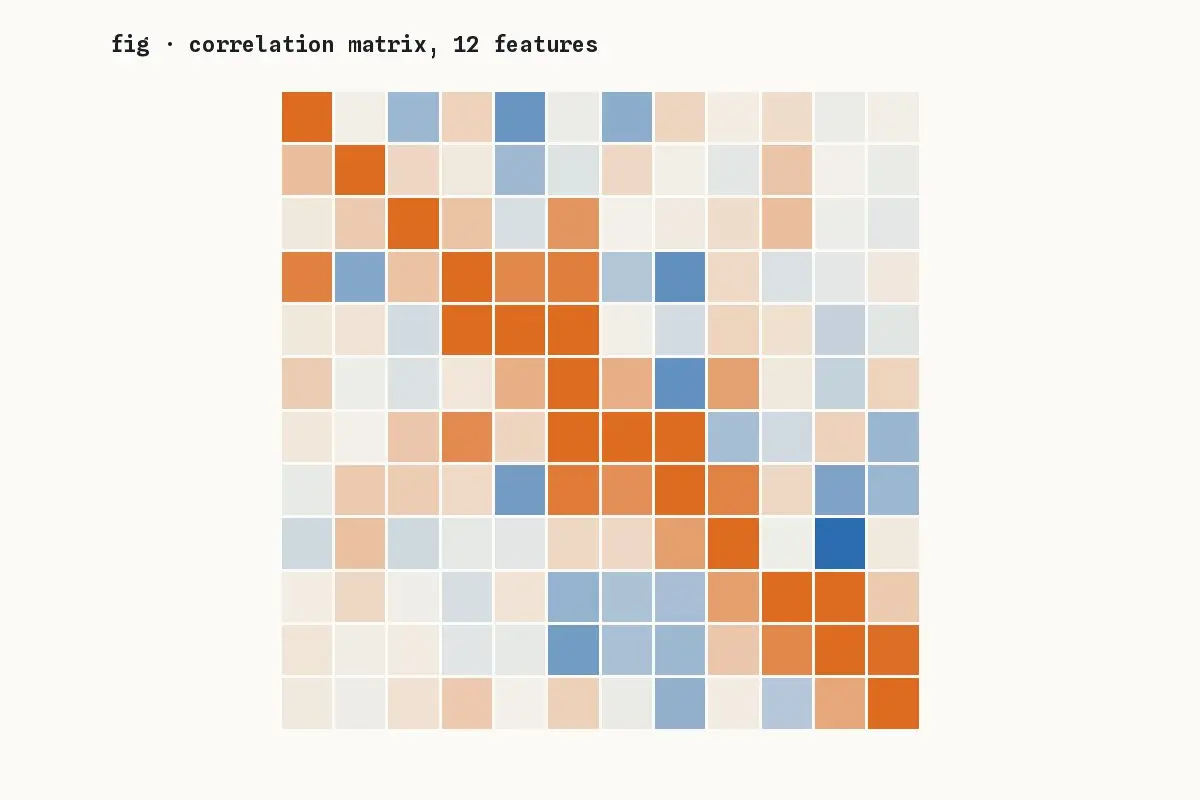
A twelve by twelve correlation heatmap in blue and orange

Methods

Reading a correlation matrix without fooling yourself

Heatmaps of correlations are everywhere in exploratory analysis. Here are the four mistakes they invite and how to avoid them.

August 27, 2026Demo AuthorRead “Reading a correlation matrix without fooling yourself” →
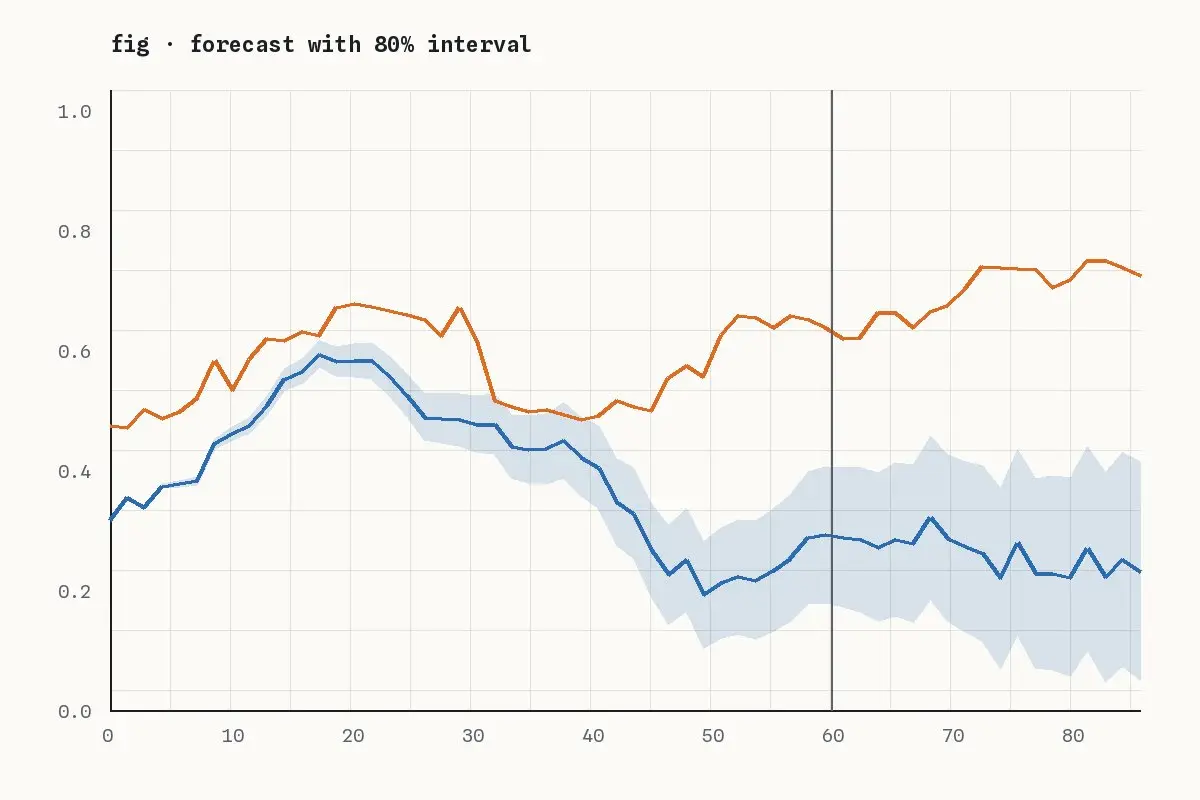
Two time series, one with a shaded interval widening into the future

Methods

Forecast intervals that widen honestly

A forecast without an interval is a guess dressed as a fact. How to produce intervals that grow with the horizon, and how to check them.

August 13, 2026Demo AuthorRead “Forecast intervals that widen honestly” →
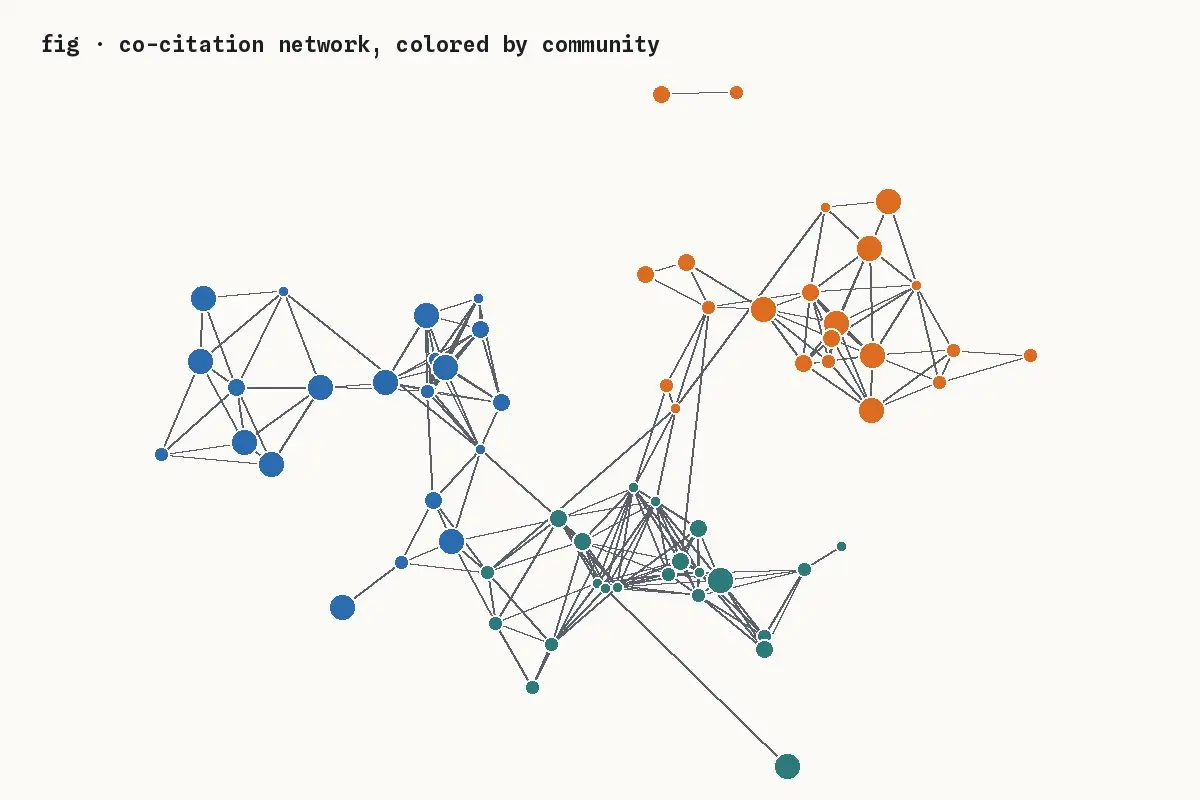
A network graph of papers colored by community

Notebooks

Mapping a research field from its citations

A co-citation network of 600 papers, community detection in three lines, and what the clusters say about how a field grew.

July 30, 2026Demo AuthorRead “Mapping a research field from its citations” →

About this notebook

Essays, notebooks and series on statistics, machine learning and measurement. Corrections are made in place and noted.

Series

  • Measuring what matters
  • Causal inference notes

Recent

  • Calibration is the forecast quality nobody checks October 22, 2026
  • Notebook: a drift monitor in forty lines of pandas October 8, 2026
  • Measuring what matters, part 1: proxies and their failure modes September 25, 2026
  • Measuring what matters, part 2: session length is a trap October 1, 2026

Margin of Error

© Margin of Error. Text and figures under CC BY 4.0 unless noted.

  • About
  • Series
  • Contact
  • Feed