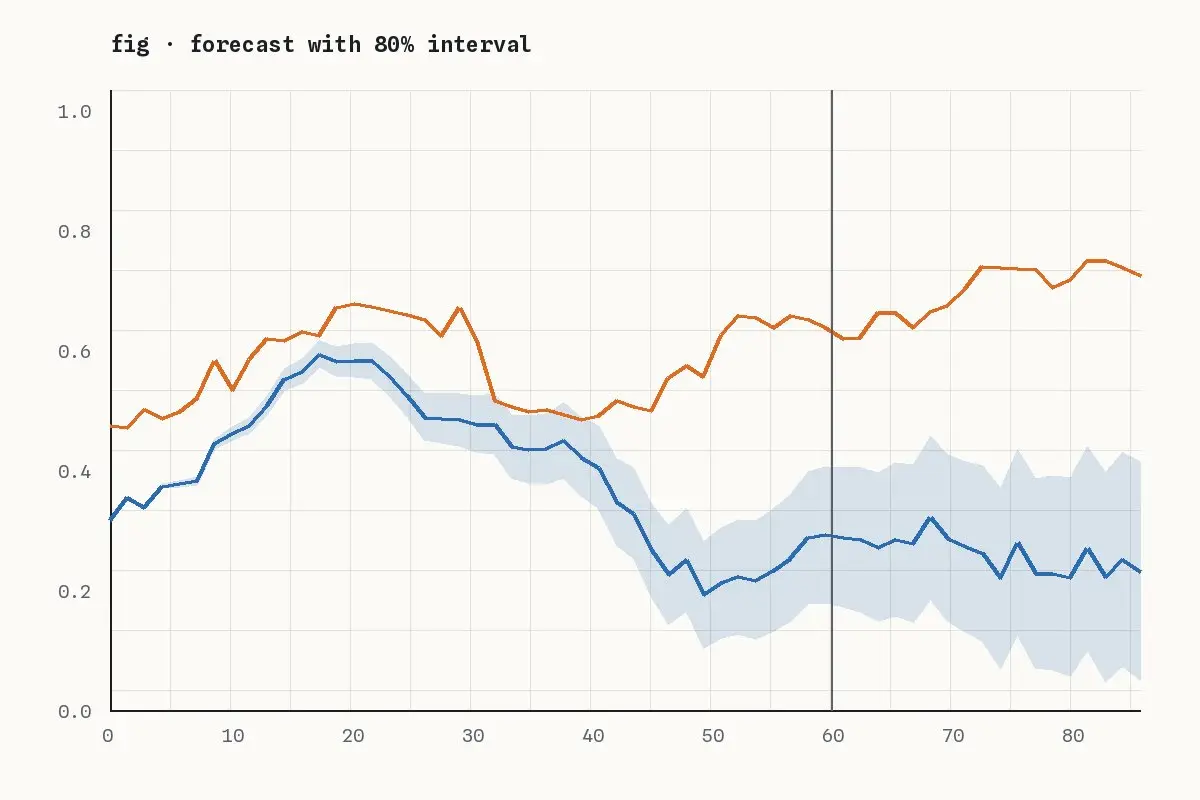
Point forecasts are easy to read and easy to over-trust. An interval says how wrong the forecast might be, and a good one grows the further ahead you look.
Intervals that stay the same width at every horizon are a warning sign: the model is ignoring how errors accumulate over time.
Three ways to get intervals
- Model-based: state-space and ARIMA models give them analytically.
- Simulation: resample residuals and roll the model forward many times.
- Bayesian: sample from the posterior predictive distribution.
Check the coverage
Backtest: for each past origin, record whether the actual value fell inside the 80% interval. Over many origins, it should do so about 80% of the time. Ours covered 71% at first, which is how we found an unmodelled holiday effect.
coverage = ((y >= lo) & (y <= hi)).mean()
print(f"80% interval covers {coverage:.0%}")