Before reaching for a monitoring product, it is worth knowing how far a few lines of pandas will take you. This notebook computes the population stability index (PSI) for each feature against a reference window.
Setup
import numpy as np
import pandas as pd

ref = df[df.ts < "2026-07-01"]
cur = df[df.ts >= "2026-09-01"]
The index
def psi(ref, cur, bins=10):
    edges = np.quantile(ref, np.linspace(0, 1, bins + 1))
    r = np.histogram(ref, edges)[0] / len(ref)
    c = np.histogram(cur, edges)[0] / len(cur)
    r, c = np.clip(r, 1e-6, None), np.clip(c, 1e-6, None)
    return float(np.sum((c - r) * np.log(c / r)))
A common rule of thumb reads PSI below 0.1 as stable, 0.1–0.25 as worth a look and above 0.25 as a real shift. Treat these as conventions, not laws.
Quantile bins from the reference window keep the index stable for skewed features; clipping avoids dividing by zero in empty bins.
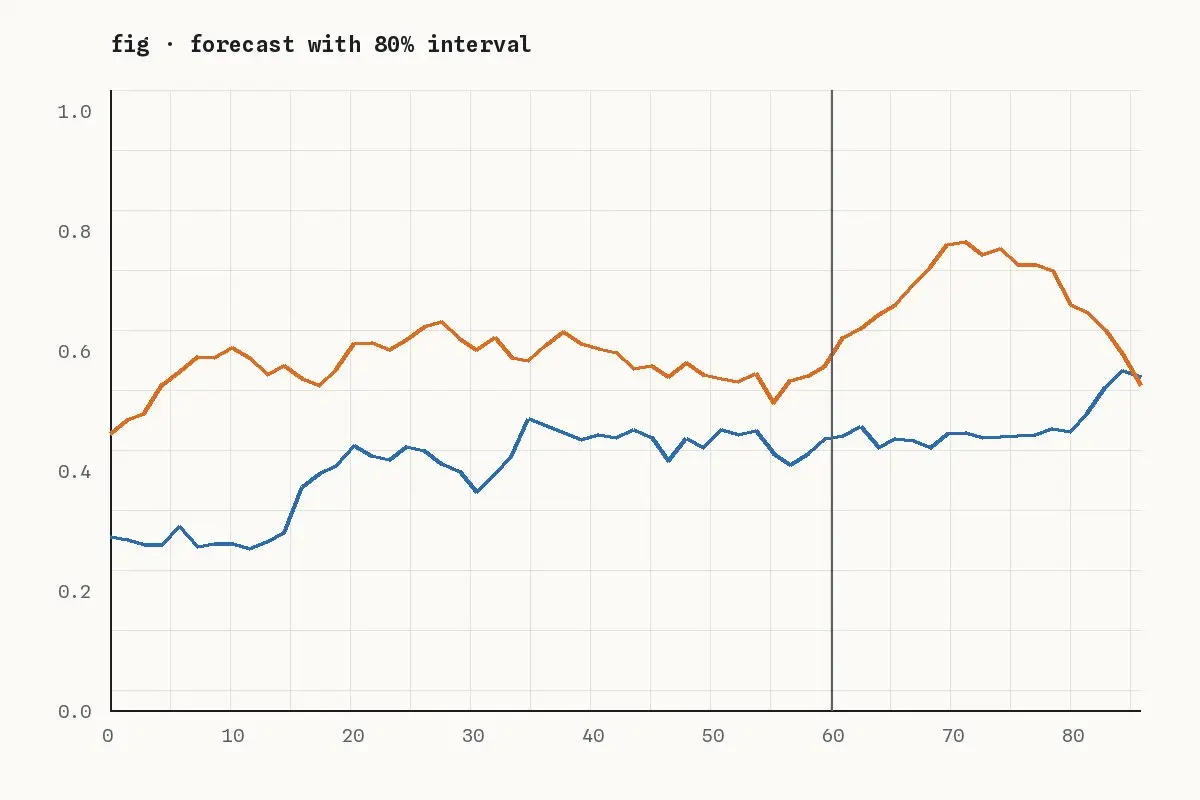
- Run it weekly per feature, store the results, plot the history.
- Alert on sustained change, not one noisy week.
- Always look at the raw distributions before acting.