Two papers are co-cited when a third paper cites both. Build a graph of those pairs and communities of related work appear on their own, without anyone tagging topics by hand.
The pipeline
- Collect references for a seed set of papers and their citers.
- Count co-citations and keep pairs cited together at least three times.
- Detect communities with a modularity-based algorithm.
- Label each community by its most-cited papers.
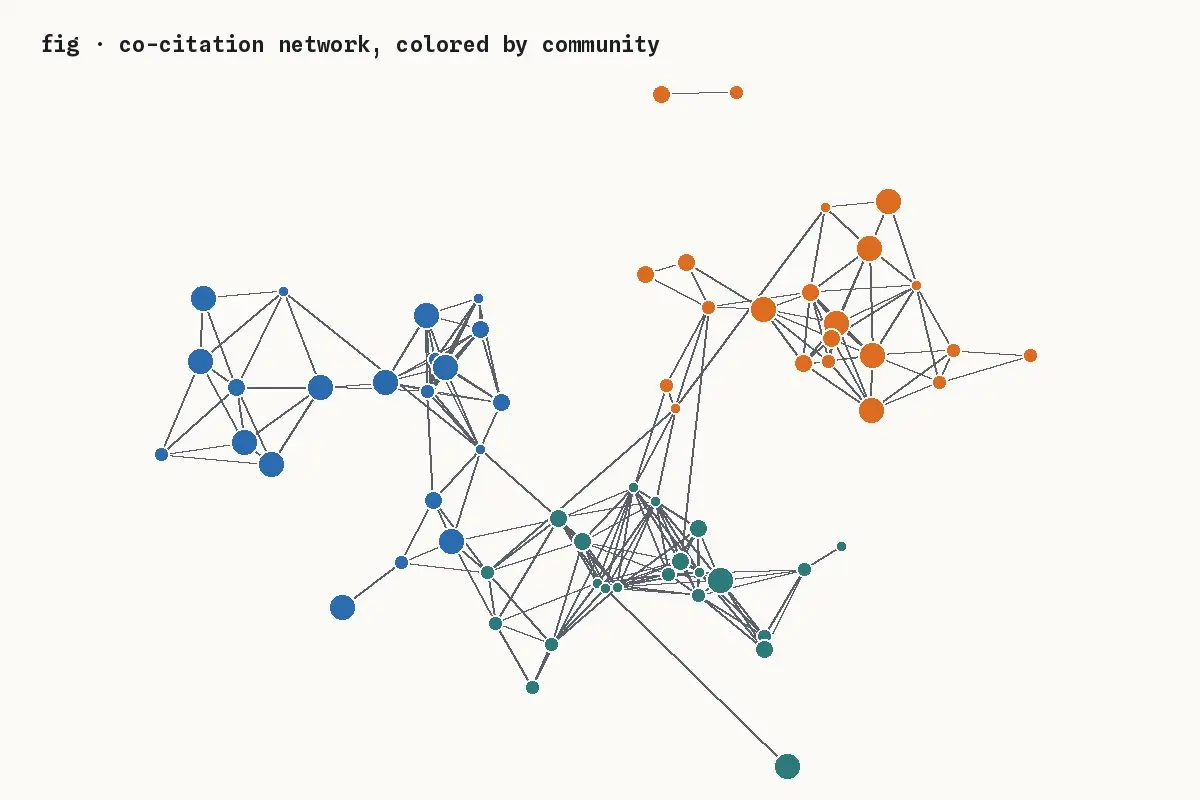
The bridging cluster is the interesting one. Its papers are recent and cite both older communities, which is what a field looks like when it starts to argue about how to measure itself.
The full notebook, with the reference data and the plotting code, is linked from the series page. It runs in under a minute on a laptop.