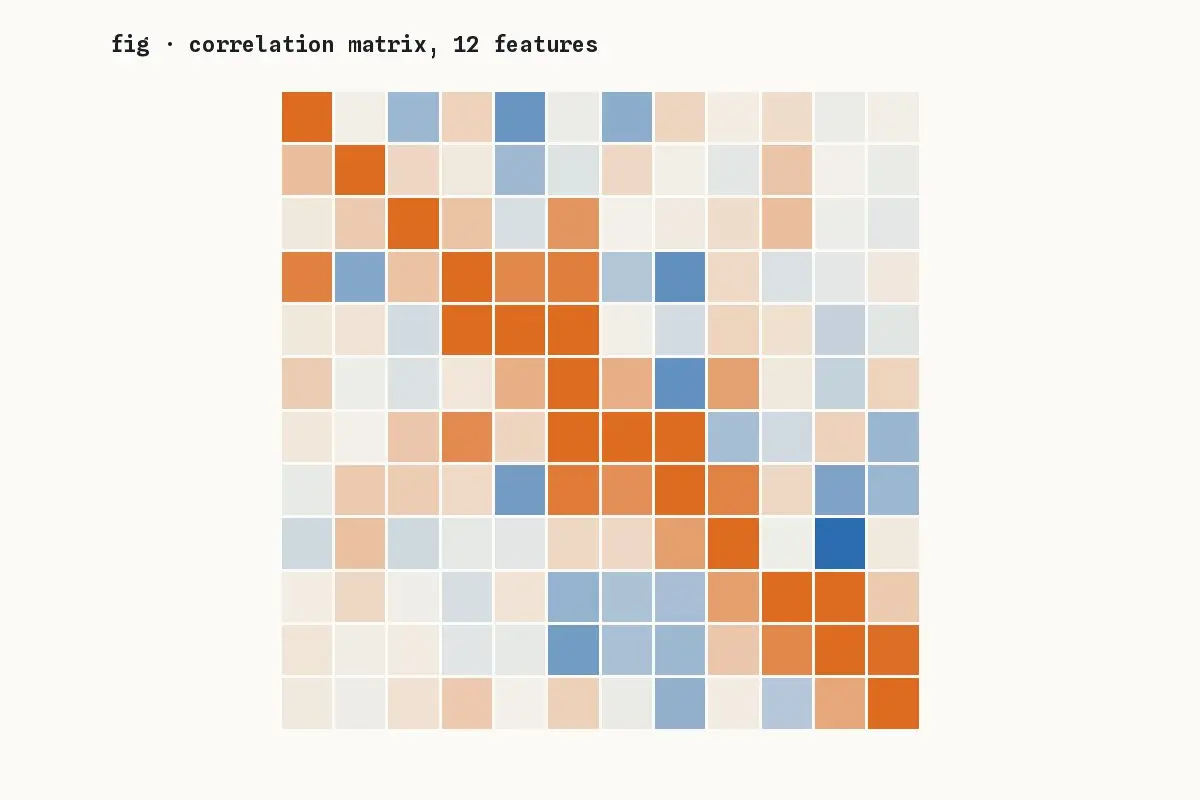
A correlation heatmap is a good first look at a new dataset and a poor last one. It compresses each pair of variables into a single number and invites stories the data cannot support.
Four traps
- Pearson’s r only sees linear relationships; a perfect U-shape scores near zero.
- A single outlier can create or hide a strong correlation.
- Correlated features are often both caused by a third you did not measure.
- Ordering the matrix by clustering makes patterns look cleaner than they are.
Do this instead
Use the heatmap to choose which pairs to plot, then look at the scatter plots. Add rank correlations alongside Pearson. And treat anything you find as a question for an experiment, not an answer.
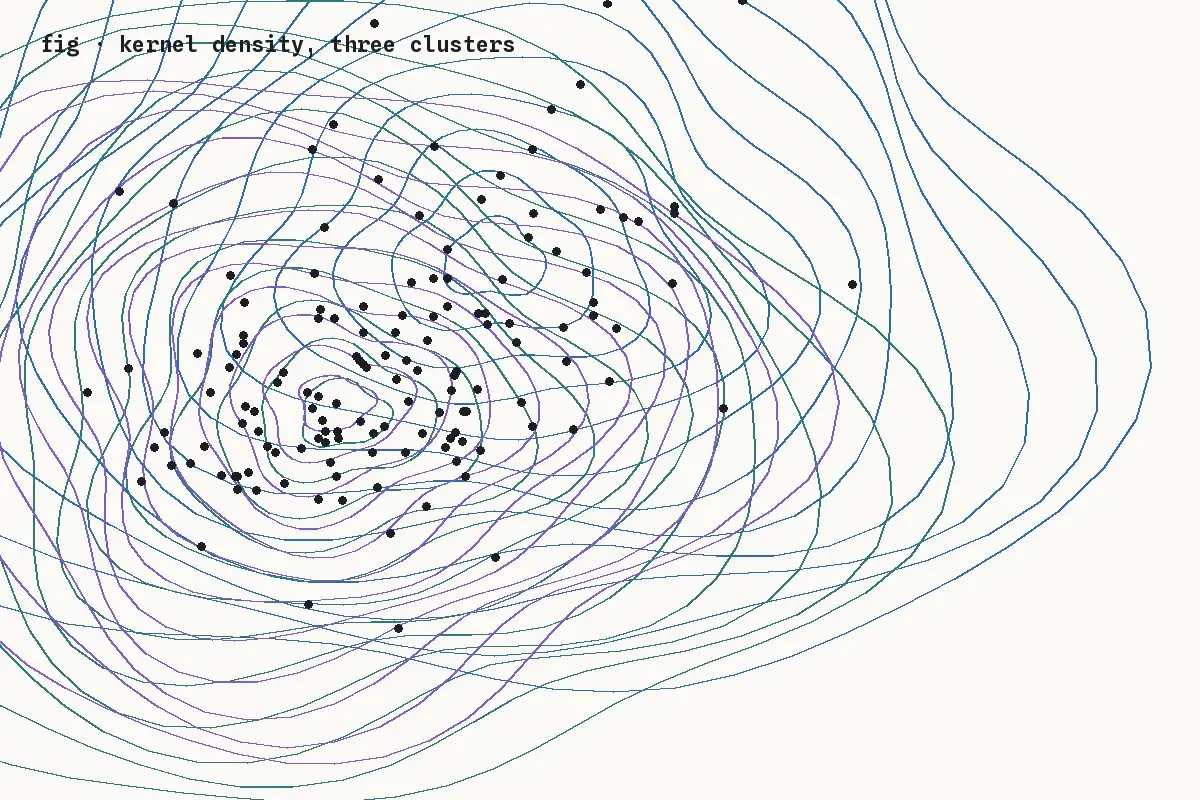
The figure below is the reason: pooled, these three groups show almost no correlation; within each group, the relationship is strong and consistent.