A chart can be built from perfectly accurate numbers and still leave the reader with the wrong idea. Usually it is not deliberate: it is the default settings doing the thinking.
Five checks
- Does a bar chart start its axis at zero?
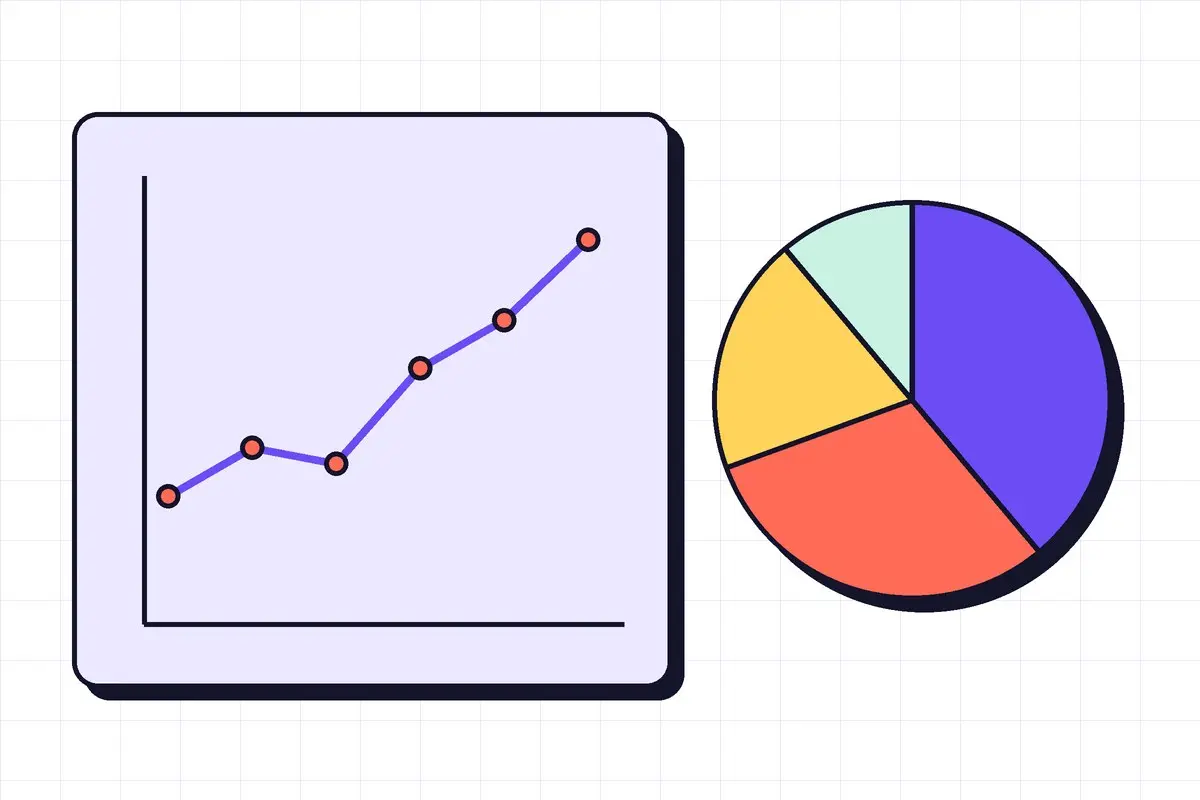
- Could the pie be a sorted bar chart instead?
- Is colour used to highlight one thing, not to decorate?
- Does the title say what the reader should notice?
- Would the chart still make sense printed in grey?
Most charting tools will happily produce a 3D exploding pie with twelve slices. Just because a setting exists does not mean the reader benefits from it.
Good charts are a kindness to the reader. They answer the question "so what?" before anyone has to ask it.